Today we learned about trend lines, which are also called line of best fit. These are lines that represent the overall behavior of the points on a scatter plot. We learned how to draw a trend line, and then we figured out the equation of our trend line. We used slope-intercept form for our equations, which is y=mx+b.
|
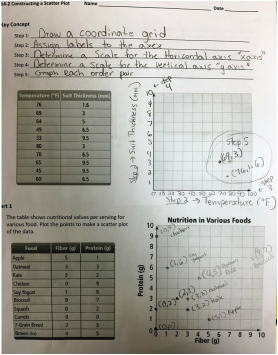
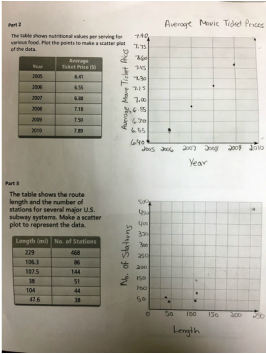
Today we looked at patterns that can appear in scatter plots. Clusters are groups of data points that are close together. A gap is an empty space with no data points. Outliers are data points that are far away from the rest of the data. Today we learned how to create a scatter plot. Creating a scatter plot is very similar to graphing points on a coordinate plane!
Today we started Unit 8 which kicks off with topic 14! In 14-1 we learned about scatter plots. A scatter plot is a graph made of dots that represent quantitative data. Quantitative data is data that answers a question like how many or how much. Money, measurements, and time are all common examples of quantitative data. Today we learned how to understand what the points on a scatter plot represent. Use the notes below (from class today) to help you with your homework tonight! |

8th Grade MathCheck out the daily happenings on this page. Archives
March 2017
Categories
All
|
 RSS Feed
